

Macromolecular FRET in the TCR/CD3 Complex: Artifacts in High-Parameter γδ T-Cell Flow Cytometry
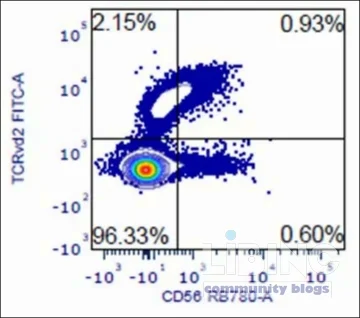
Macromolecular FRET in the TCR/CD3 complex shapes data interpretation in high-parameter γδ T-cell panels. This article examines how proximity-driven energy transfer between fluorochromes bound to receptors within the same macromolecular complex can masquerade as biological signals. The analytical challenge goes beyond standard spectral spillover and compensation, demanding a revised framework for panel design and controls. We explore why these non-spectral fluorochrome interactions arise, how to diagnose them, and what practitioners can do to safeguard data integrity in multiparametric flow cytometry. The discussion centers on a concrete case where a FITC-conjugated TCR Vδ2 antibody coincided with an RB780-detected signal, prompting a re-evaluation of assumptions about fluorochrome compatibility and receptor proximity.
- Analytical perspective: deciphering the proximity-driven FRET signal
- Contrast with spectral spillover and compensation artefacts
- Mechanism and cause-and-effect in the TCR/CD3 complex
- Expert reconstruction: panel design and controls to mitigate artifacts
Analytical perspective: deciphering the proximity-driven FRET signal in γδ T-cell panels
The starting puzzle is that γδ T-cell panels simultaneously tag components in the TCR/CD3 complex, placing fluorochromes within nanometer-scale distances. In this context, non-spectral fluorochrome interactions emerge as a plausible source of artifactual signals, driven by fluorochrome proximity rather than spectral bleed. The analytical approach must treat these interactions as a form of macromolecular energy transfer that can mimic true phenotypes, demanding revised interpretation frameworks for RB780 readouts and related channels. These non-spectral interactions rest on a substrate of molecular crowding and receptor co-localization, making them a systematic consideration rather than a one-off anomaly.
The γδ T-cell panel analyzed included CD3, TCR γδ, TCR Vδ2, TCR Vγ9, and CD56. Within this configuration, an unusual RB780 signal appeared when TCR Vδ2 was labeled with FITC. The artifact resembled under-compensation at first glance, but comprehensive spectral analyses showed no conventional emission overlap between FITC and RB780. The discrepancy pointed toward a proximity-driven mechanism—one that requires both careful fluorochrome selection and a recognition that receptor clustering can foster energy transfer across macromolecular kilometers of distance that are still nanometer-scale at the molecular level. This recognition shifts the interpretation of RB780 readouts from a purely optical issue to a biophysical interaction within the TCR/CD3 complex.
To interrogate the artifact rigorously, investigators performed a matrix of single-stain controls, fluorescence-minus-one (FMO) controls, and panel modifications. The critical finding: removing CD3 APC-Cy7 from the panel abolished the RB780-associated signal. This outcome aligns with a FRET-like hypothesis in which TCR Vδ2-FITC functions as the donor and CD3-APC-Cy7 as the acceptor when both epitopes reside in the same receptor cluster. The absence of the RB780 signal when the donor-acceptor pair is disrupted underpins a proximity-dependent energy transfer mechanism rather than a conventional spectral artifact. The inference is that the TCR/CD3 complex spatially concentrates fluorochromes in a way that enables non-radiative energy transfer, ultimately manifesting as a false-positive near 780 nm emission.
Another layer of analysis used is cross-checking with multiple panel configurations and controls. Full-stain conditions consistently produced the RB780 anomaly in the presence of CD3 APC-Cy7 and TCR Vδ2-FITC, whereas the DMSO- or buffer-only controls showed no such signal. Fluorescence-minus-one controls, when designed to isolate CD3 APC-Cy7 or TCR Vδ2-FITC, helped delineate whether the RB780 signal arose from a spectral spillover or a non-spectral interaction. Taken together, the data support a model where macromolecular FRET—driven by close molecular proximity within the TCR/CD3 complex—produces a detectable RB780 signal independent of direct FITC-to-RB780 spectral overlap. This conclusion carries broad implications for high-parameter flow cytometry in receptor complexes, where co-localization can drive energy transfer despite clean spectral boundaries on the cytometer.
From a methodological viewpoint, these observations underscore the necessity of FMO controls that specifically test for proximity-driven artifacts. FMOs must extend beyond simple channel exclusion; they should probe the behavior of donor-acceptor pairs in a panel when one component is omitted or substituted. In this case, substituting TCR Vδ2-FITC with CD3-FITC eliminated the artifact, offering a direct experimental falsification of a purely spectral explanation. The implication for practice is clear: FMO controls become diagnostic tools for unrevealed macromolecular interactions, not merely noise reduction techniques. The analytical takeaway is that fluorochrome interactions within receptor complexes constitute a non-negligible source of artifactual signals that require explicit acknowledgment in study design and interpretation.
Beyond this specific case, the analytical framework extends to other receptor systems with tight clustering, such as TCR/CD3, BCR/associated CD79, or cytokine receptor arrays. The central question becomes whether any observed channel anomaly tracks with co-localization patterns expected from receptor architecture. If so, a FRET-like mechanism may be at play, necessitating a re-evaluation of gating strategies, compensation logic, and the expected biology. The recurring pattern is the need to connect physical fluorochrome interactions to observed cytometric readouts, thereby reframing artifacts as informative signals about the nano-scale organization of surface receptors rather than mere measurement errors.
Contrast with spectral spillover and compensation artefacts
Traditional compensation assumes fixed spectral spillover between fluorochromes with well-characterized emission profiles. In the cases described, RB780 reads a distorted signal despite minimal direct FITC-to-RB780 overlap. The instrument configuration used for the investigation supports this interpretation: the RB780 detector sits in a window that does not directly intersect the blue-laser FITC emission, yet a signal appears in RB780 when TCR Vδ2-FITC and CD56 are co-stained. The observed discrepancy points to a non-spectral energy transfer mechanism, not to classical spillover, which is typically addressable by compensation matrices. Recognizing this distinction is crucial because it shifts the diagnostic focus from correcting spectral overlap to examining molecular proximity and fluorochrome interactions within receptor complexes.
Energy transfer in this context is not driven by a simple emission overlap; it arises from a non-radiative exchange between donor and acceptor fluorochromes that are positioned within the nanometer range. In concrete terms, excitation of FITC can energize an adjacent APC-Cy7 molecule via dipole-dipole coupling, leading to emission in a spectral region that RB780 detects. Because this pathway does not depend on a direct spectral overlap, standard compensation fails to resolve the artifactual RB780 signal. The practical implication for experimenters is to broaden the scope of artifact testing beyond spillover matrices, incorporating proximity-focused hypotheses into panel validation workflows. The goal is to distinguish genuine biology from fluorescence interactions that stem from receptor organization rather than cellular state.
The proximity-driven energy transfer aligns with the physics of Förster resonance energy transfer (FRET), which requires donor and acceptor fluorochromes to be within approximately 1–10 nanometers. In receptor complexes like TCR/CD3, antibodies conjugated to neighboring epitopes can produce donor-acceptor configurations compatible with FRET. Importantly, the excitation of donor fluorochromes (eg, FITC) initiates a cascade in which energy can be non-radiatively transferred to an adjacent acceptor (eg, APC-Cy7). This energy transfer culminates in emission at wavelengths that may be indistinguishable from true receptors' phenotypic signals, thus generating a deceptive RB780 readout. The contrast between spectral spillover and FRET in this context is not academic; it determines how we interpret complex immune phenotypes in high-parameter panels.
From an instrumentation perspective, the issue is not simply the optical filters but also the specifics of the macromolecular arrangement and how fluorochromes are positioned on antibodies bound to proximate proteins. When the TCR/CD3 complex is engaged, the spatially constrained fluorochrome pairs become ripe for energy transfer. That means even well-calibrated detectors can register artifacts that have the hallmarks of biology but derive from physical fluorophore properties. A rigorous approach to instrument configuration must acknowledge that proximity can produce energy transfer signatures, and detection windows may capture the consequences of these macromolecular interactions rather than purely spectral bleedover. The consequence for data interpretation is that we must consider both spectral and non-spectral sources of readout variation when evaluating γδ T-cell phenotypes.
Mechanism and cause-and-effect in the TCR/CD3 complex
The mechanistic picture centers on the physical assembly of TCR and CD3 complexes on the cell surface. When CD3 APC-Cy7 and TCR Vδ2-FITC co-localize within the receptor cluster, excitation at 488 nm elevates FITC to an excited state. Instead of releasing this energy solely through FITC's standard emission pathway, non-radiative dipole-dipole coupling transfers energy to APC-Cy7 within a nanometer-scale distance. APC-Cy7 then emits fluorescence near 780 nm, which RB780 detects as an apparent signal. This energy-transfer pathway is consistent with the observed dependence on CD3 and TCR co-staining and with the absence of the effect when either partner is removed or replaced. The proximity criterion—a prerequisite for FRET—explains why standard compensation cannot fix the readout and why the artifact persists across multiple staining schemes that keep the donor-acceptor pair intact.
The experimental design that supports this model rests on a série of targeted substitutions and FMOs. When researchers replaced TCR Vδ2-FITC with CD3-FITC, the RB780 anomaly vanished, a result that would be unlikely under a purely spectral spillover explanation. Conversely, FMOs that include the donor or the acceptor from the pathway re-create or abolish the artifact depending on whether the critical pair remains in proximity. This causal chain—donor-acceptor proximity in the TCR/CD3 complex enabling energy transfer to produce a near-780 nm signal—provides a coherent narrative that connects physical fluorochrome properties to observed cytometric readouts. It also highlights a broader lesson: in receptor-rich membranes, fluorochrome proximity becomes a determinant of readout, not merely a nuisance to be managed through compensation.
Beyond the specific CD3/TCR system, this mechanism resonates with other immunophenotyping contexts where multiple antigens lie in tight proximity on the same cell surface. For those designs, energy transfer between fluorochromes bound to adjacent epitopes might create unforeseen signals in channels distant from the initial donor emission. This realization invites a rethinking of panel composition, not simply to avoid overlap but to minimize physical interactions among fluorochromes bound to tightly clustered proteins. It also suggests that certain detector channels could be more susceptible to proximity-driven artifacts depending on the receptor architecture and fluorochrome properties, making cross-checks across channels essential in high-parameter analyses.
In practice, understanding the mechanism informs a set of diagnostic steps for panel validation. Any observed artifact that persists across full-stain and FMOs but disappears when a critical donor-acceptor pair is removed points to a FRET-like energy transfer rather than a spectral leakage. The mechanistic model thus translates into concrete controls: substitution of components with non-overlapping positions, deliberate disruption of proximal pairs, and rigorous testing with single-stain and FMO panels. The combined evidence supports the conclusion that macromolecular fluorochrome interactions within receptor complexes can drive energy transfer and produce misleading signals in flow cytometry measurements. This understanding elevates the importance of considering physical proximity in experimental design and interpretation, especially for γδ T-cell phenotyping where receptor co-localization is intrinsic to biology.
Expert reconstruction: panel design and controls to mitigate artifacts
To mitigate proximity-driven FRET artifacts in high-parameter panels, practitioners should adopt a design philosophy that minimizes fluorochrome pairs located on proteins within the same receptor complex. Consider swapping donor-acceptor combinations or selecting fluorochromes with less favorable FRET properties. Incorporate FMO controls for both donor and acceptor channels across all relevant tubes, and verify abnormal RB780 or similar channels with single-stain tests and antibody substitutions. Build redundancy in panels by testing multiple configurations on the same instrument to detect instrument-specific biases and non-spectral interactions. The overarching aim is to prevent proximity-driven energy transfer from confounding the interpretation of receptor phenotypes, especially for densely packed surface complexes like TCR/CD3.
- Fluorochrome proximity considerations: Plan fluorochrome combinations with proximity in mind to minimize non-spectral interactions and energy transfer.
- Comprehensive FMO controls: Use FMO controls for both donor and acceptor channels across relevant tubes to reveal proximity-driven readouts.
- Single-stain validation: Validate with single-stain controls to detect non-spectral energy transfer patterns that arise only when multiple fluorochromes are present on nearby epitopes.
- Cross-instrument reproducibility: Verify results across instruments to detect platform-specific proximity artifacts and to ensure robustness of conclusions.
- Detector window awareness: Be mindful of detector windows that can capture emission via indirect energy transfer, potentially revealing hidden artifacts in channels like RB780.
These principles translate into a practical workflow for panel construction. Start by mapping the receptor architecture to anticipate which antigens will be co-localized in the same complex. Then, design fluorochrome pairs to minimize potential FRET within that geometry. Apply FMOs early in the process to identify channels that might be susceptible to proximity artifacts, and perform confirmatory experiments by substituting donor-acceptor pairs with non-overlapping configurations. Finally, harmonize panel optimization across instruments to ensure the observed artifacts are not instrument-specific curiosities but intrinsic features of receptor organization in the analyzed cells. This disciplined approach improves data integrity and confidence in downstream biological inferences.
In summary, macromolecular FRET within the TCR/CD3 complex yields reproducible artifacts that complicate interpretation of high-parameter T-cell panels. By prioritizing FMO-based discrimination, controlled fluorochrome substitutions, and deliberate panel construction, researchers can separate true biology from artifactual signals. The practical discipline is to anticipate non-spectral fluorochrome interactions as a design constraint, thereby safeguarding data integrity in flow cytometry studies. The take-home message is that rigorous controls and thoughtful fluorochrome selection are not optional extras but essential components of reliable immunophenotyping in complex receptor systems.
Closing the diagnostic gap: practical protocol for proximity-driven artifacts
In practice, researchers require a concrete, repeatable protocol to separate true biology from proximity-driven energy transfer in densely co-localized receptor complexes. This section translates the concept into a stepwise workflow that can be implemented in routine high-parameter panels, reducing ambiguity around RB780-like signals and other non-spectral readouts.
Without such a workflow, analyses risk misattributing artifactual signals to biology, particularly in γδ T-cell panels where TCR/CD3 co-localization concentrates dyes within nanometer scales. The diagnostic mindset treats proximity-driven energy transfer as an interpretable artifact that informs panel design and data interpretation, rather than a mysterious measurement glitch. The approach relies on deliberate controls, dye selection, and documentation that ties observed signals to physical fluorochrome interactions.
| Step | Action | Outcome | Notes |
|---|---|---|---|
| 1 | Map receptor co-localization in the intended panel | Identify candidate donor-acceptor pairs likely to be within 1–10 nm | Prioritize pairs with non-overlapping biological targets to minimize proximity risk |
| 2 | Perform single-stain and matrix controls | Baseline donor/acceptor behavior in the absence of proximity interactions | Establish reference readouts for each dye independently |
| 3 | Include fluorescence-minus-one (FMO) controls for donor and acceptor channels | Reveal non-spectral readouts when one component is omitted | Document which omissions reproduce or abolish the artifact |
| 4 | Test cross-panel dye swaps and alternative donor-acceptor pairs | Confirm artifact is reduced or eliminated when critical pairs are perturbed | Use multiple configurations to prove non-spectral origin |
In practice, this workflow should be embedded in standard operating procedures, with explicit criteria for when a RB780-like signal is considered artifact versus potential biology. Documentation should capture panel configuration, control results, and justification for dye choices, enabling reproducibility across experiments and instruments.
The practical takeaway is to treat proximity as a design constraint, not a post hoc nuisance. A disciplined, transparent protocol reduces ambiguity, supports reliable immunophenotyping in complex receptor systems, and strengthens conclusions about TCR/CD3 biology in γδ T cells.
- Donor-acceptor proximity awareness
- Prioritize dye pairs with minimal Förster transfer potential in the target geometry
- Consider swapping donor or acceptor to break proximity chains
- Comprehensive controls
- FMOs for both donor and acceptor channels across tubes
- Single-stain redundancy to benchmark unexpected readouts
- Cross-instrument validation
- Repeat tests on multiple cytometers to confirm artifact behavior is biology-agnostic
- Document instrument-specific biases and adjust panel configuration accordingly
| Instrument | Action | Rationale | Expected outcome |
|---|---|---|---|
| Cytometer A | Dye swap and re-run panel | Identify instrument-specific artifacts | Artifact reduces or shifts, confirming non-spectral origin |
| Cytometer B | Controller-initiated control tests | Ensure consistent results across platforms | Confirm generalizability of the proximity effect |
With these steps, practitioners promote robust, interpretable data in complex receptor systems and maintain confidence in downstream conclusions about TCR/CD3 biology.
What is macromolecular FRET in flow cytometry?
Macromolecular FRET in flow cytometry describes energy transfer between donor and acceptor fluorochromes bound to adjacent components within a dense receptor complex, creating signals in channels that can resemble the biology of interest; this occurs when dyes are within 1–10 nanometers, enabling nonradiative dipole coupling that shifts energy to unexpected spectral windows, and the readout can appear as a true marker even when the biology is unchanged.
In practice, this artifact challenges interpretation in high-parameter panels and demands diagnostic controls that identify proximity-driven transfer rather than spectral spillover alone.
How can proximity-driven energy transfer mimic true signals in flow cytometry data?
Proximity-driven transfer can produce emissions in channels distant from the donor, especially when donor and acceptor lie in a receptor cluster, creating a readout that resembles a legitimate marker. The effect is governed by nanometer-scale distances, not by spectral overlap, so standard compensation fails to distinguish it from biology and requires targeted panel testing to separate the two possibilities.
Practically, this means conducting donor-acceptor substitutions and proximity-focused FMOs to determine whether the signal persists when the proximity pair is disrupted.
What controls help distinguish spectral spillover from proximity artifacts?
Effective controls include single-stain and FMO panels that omit one component at a time, donor-acceptor substitution tests, and cross-panel swaps to observe whether the signal tracks proximity rather than biology. These controls reveal whether a RB780-like readout arises from energy transfer within a receptor complex rather than from spectral bleedover.
Documented changes across configurations strengthen the case for a proximity artifact and guide subsequent panel design decisions.
What are FMO controls and how should they be used in proximity artifact testing?
Fluorescence minus one controls isolate each dye's contribution, enabling detection of non-spectral interactions that appear only when multiple fluorochromes are present in proximity. In proximity artifact testing, FMOs should be designed for both donor and acceptor channels, and applied across all relevant tubes to reveal hidden artifactual readouts.
Used systematically, FMOs help distinguish real phenotypes from proximity-driven signals and inform dye selection and panel topology.
Which fluorochrome pairs are most prone to proximity artifacts in TCR/CD3 panels?
Pairs where donor and acceptor are bound to neighboring epitopes within the TCR/CD3 complex are most at risk, particularly when the donor dye is efficiently excited under the instrument's laser and the acceptor tolerates energy transfer to a distant spectral window. The risk increases in high-density receptor regions and in panels that emphasize co-expression within the same cluster.
Thus dye chemistry and epitope geometry should guide pair selection to minimize non-radiative energy transfer.
How can panel validation be performed across instruments to ensure robustness against proximity artifacts?
Cross-instrument validation involves repeating key tests on multiple cytometers, using the same panel and the same control configurations, while swapping dyes as needed to test for platform-specific effects. Documentation should capture any persistent proximity signals across instruments and link them to panel design decisions.
Such validation demonstrates generalizability and strengthens confidence in interpreting complex immunophenotypes.




Add a comment
To comment, you need to register and authorize
Comments