

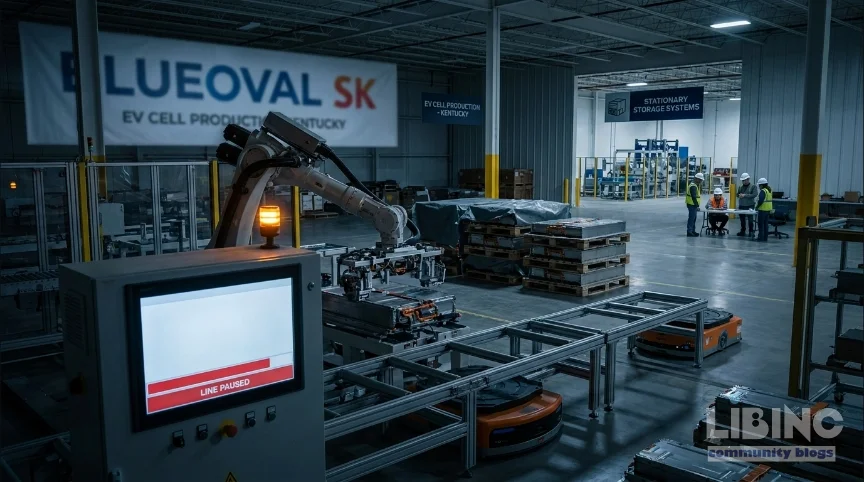
Cell utilization redefined: how the U.S. battery industry pivots from nameplate ambition to real-world throughput
Table of contents
- Block 1: Through analytics — mapping nameplate capacity to actual utilization
- Block 2: Through contrast — EV line closures vs. ESS pivots across states
- Block 3: Through cause-and-effect — policy and economics driving idle lines
- Block 4: Through expert reconstruction — paths forward for operators, suppliers, and investors
The U.S. battery cell industry has crossed a threshold that the 2022–2024 groundbreaking era did not anticipate: more cell capacity is being commissioned than the domestic EV market can absorb. This misalignment surfaces not in celebratory press releases but in plant-closure notices, paused production lines, and retooling announcements that quietly convert EV-capacity into stationary-storage capacity. The clearest signals emerge in three states: Kentucky, Ohio, and Kansas. In Kentucky, the Ford/SK On BlueOval SK Battery Park is scheduled to close on February 14, 2026, with all 1,512 workers laid off as the joint venture dissolves in early 2026. In Ohio, Ultium Cells paused Lordstown cell production in January 2026, laying off 1,334 hourly workers, with a staggered recall now pushed toward August 2026. In Kansas, Panasonic's De Soto plant is ramping toward roughly 50% capacity with no public date for a full production restart. These aren’t isolated anecdotes; they establish a new baseline for what the industry can expect from utilization rather than outright nameplate ambition. The central question now is: which portion of the 700+ GWh of capacity under construction or commissioning will actually ship a cell in 2026, and how the 45X advanced-manufacturing credit reshapes the economics of lines that run below design rate. The focus has shifted from how big the pipeline looks to how efficiently that pipeline translates into real throughput.
To frame the issue, the 45X advanced-manufacturing credit remains pivotal. It pays per unit of output rather than per investment, creating a design-for-output incentive that keeps lines alive even as utilization dips. The per-kWh credits—$35 for cells and $10 for modules—are chemistry-agnostic on the cell side, enabling lines to pivot from EV chemistries to stationary-storage chemistries without eroding the incentive structure. Yet the credit’s value is contingent on utilization: a line running at 50% generates roughly half the 45X benefit of a full-capacity line, all else equal. In other words, the depreciation of the asset base happens on pace with a shrinking output, compressing economics when the plant sits idle. This is the core tension modern manufacturing faces: the credit protects the asset, but it cannot substitute for demand or efficient operation. LSI: utilization rate, nameplate capacity, 45X credit
From a data perspective, the arc is revealing. Treasury and industry data around mid-2025 show approximately $48.3 billion in U.S. battery manufacturing investments supporting roughly 62,700 jobs, with the bulk concentrated in Korean-OEM joint-venture plants. Public capacity trackers, including academic monitors of North American battery production capacity and Argonne National Laboratory’s announced-capacity dataset, document a pipeline well over 700 GWh under construction or commissioning, versus roughly 200 GWh online in 2024. BloombergNEF scenarios caution that utilization could dip below 70% in 2026 as nameplates outrun demand, a vision echoed by the IEA’s Global EV Outlook 2026. The arithmetic is unforgiving: an 85–90% utilization assumption becomes untenable when lines run at 50% or sit dark. The implication for operators is stark: the economic math hinges on converting nameplate capacity into reliable, high-utilization throughput. LSI: nameplate capacity, pipeline capacity, EV demand
Inline with this shift, an SVG diagram embedded here outlines the relationship between nameplate capacity and utilized capacity across typical gigafactory lines, illustrating how utilization drags down the return on invested capital when demand does not materialize. The visual shows three scenarios: full utilization for EV lines, partial utilization with EV-LFP conversions for ESS, and idle lines with depreciation continuing. While visuals cannot replace market data, they reinforce the central point: cell utilization is the defining metric for profitability and risk management in 2026. LSI: grid-scale storage, stationary storage, ESS
Block 1 — Through analytics: From nameplate ambition to actual utilization
The industry’s first-order hypothesis—more capacity equals more value—has morphed into a second-order reality: utilization is the bottleneck. Analysts observe that the U.S. went from a net cell-import market to a cell-manufacturing market in roughly four years, with a pipeline outpacing near-term demand. This is not merely a production problem; it is a market design problem. When a plant sits at 50% utilization, the 45X credit is still earned on the cells produced and sold, but the depreciation of the installed base continues. The economics tilt toward reconciling a line’s capabilities with the actual offtake pipeline. LSI: depreciation, output credit, utilization
To translate this into concrete terms, consider the Kentucky instance. BlueOval SK’s Glendale campus will enter a period of dormancy as production winds down, but the broader implication is not only a wind-down but a pivot: the 5.8 billion capex sunk into the site will not be fully realized in the conventional EV-output sense. Its implications ripple through the supply chain—coater lines, calenders, and formation cyclers are now viewed as part of a flexible portfolio of assets whose value is determined by how quickly they can be repurposed for ESS cycles if demand slows. The first-order conclusion is that cell utilization determines the fate of multi-billion-dollar plants and their associated equipment suppliers. LSI: capex sunk, coater lines, equipment amortization
In practical terms, the 45X framework has created an incentive structure that can sustain idle capacity only if the asset can pivot to either higher utilization or a different chemistry without eroding the credit value. The risk is that pivoting becomes the default and the ESS market becomes oversupplied if offtake from grid-scale storage is not paced to demand. The data point from De Soto—two of eight lines in operation with no commitment to full ramp—illustrates a cautious, staged approach to capacity utilization. The optimization problem shifts from “build more plants” to “adapt and schedule lines for the most valuable output given demand signals.” LSI: pivot strategy, ESS demand, offtake pacing
Block 2 — Through contrast: EV line closures vs. ESS pivots across states
The most concrete illustrations come from state-level actions. Kentucky’s BlueOval SK site embodies the worst-case scenario of a dissolution: 1,512 workers off, a shutdown dated for February 2026, and a broader signal that the EV-capacity buildout is encountering structural demand limits. The layoff wave is not a failure of the site alone but a symptom of a market rebalancing where the economics of a fully utilized EV line no longer align with policy shifts and consumer demand curves. The implication for the supply chain is sector-wide: the line capacity that was once justified by EV demand now requires either a rapid lift in utilization or a transition to alternative outputs. LSI: shutdown, workforce impact, EV demand decline
Ohio’s Ultium pause at Lordstown and the delayed recall underscore how demand softness interacts with labor, equipment, and contract risk. The January 2026 pause represents more than a temporary hiccup—it signals the fragility of a multi-line plant network that relies on high utilization to sustain the 45X economics. A recall delayed to August 2026 keeps liquidity in the system while preserving option value for retooling and redeployment. The pattern across states is consistent: when one EV line stalls, others reallocate assets toward stationary storage—often through LFP retooling or the introduction of ESS lines—rather than simply waiting for EV demand to rebound. LSI: labor risk, recall timing, ESS pivot
In Kansas, Panasonic’s De Soto plant shows a more methodical version of the same transition. The target ramp to full production by March 2027 was slowed, and early 2026 reporting indicates only partial enabling of lines with no public commitment to a full ramp. The lesson is not a production pause alone but a strategic delay with the option value preserved for later deployment. The plant stays partially online, equipment is installed in a staged fashion, and the cadence mirrors the broader market’s preference for pacing over pressure. LSI: staged ramp, option value, pacing
Industry-wide, the pivot to stationary storage has some of the most visible consequences in the large players’ strategies. LG Energy Solution’s first U.S. LFP plant for ESS, and Samsung SDI’s 2026 ESS start at Kokomo, illustrate a deliberate reallocation of lines from EV cells to ESS chemistries. SK On’s pivot amid Ford’s split continues to redirect remaining capacity toward ESS, while the 60–85% FEOC-content thresholds from the One Big Beautiful Bill Act introduce a localization requirement that reshapes the cost structure of every line that stays in EV production. These contrasts are not random; they reflect a calculated shift toward preserving asset value in the face of a demand trajectory that was revised downward after 2023. LSI: ESS pivot, FEOC thresholds, localization
Collectively, these contrasts reveal a sector that is retooling on the fly. The pivot is not a halt in investment but a reallocation of capital toward lines that can still earn 45X credits while aligning with domestic-content requirements. The risk remains in scale: if ESS offtake does not keep pace, the entire framework risks a second round of utilization compression. The key question for suppliers and operators is whether they can time dry-room buildouts and second-wing construction to preserve optionality without overcommitting to a single output. LSI: optionality, dry-room timelines, ESS demand pacing
Block 3 — Through cause-and-effect: policy and economics driving idle lines
The backbone of the current dynamic is the 45X credit structure. The per-kWh incentives—$35 for cells and $10 for modules—are designed to reward output rather than investment. The result is a parallel risk where lines pressed to full nameplate capacity in earlier years encounter diminishing returns when utilization deteriorates. This is the core cause-and-effect dynamic: policy support that values output can simultaneously incentivize underutilization if demand fails to materialize. The effect is a bifurcated capital cycle where assets remain on the books, depreciation continues, and the economics of every line depend on actual throughput rather than theoretical capacity. LSI: output-based credit, depreciation underutilization, policy impact
The regulatory overlay exacerbates the risk. The One Big Beautiful Bill Act maintains 45X but imposes foreign-entity content thresholds that ratchet upward through 2030. The consequence is a tightening of the domestic-content requirement on the kWh that qualify, which compresses both halves of the unit economics for lines operating with imported components. For plants with mixed supply chains, the FEOC rules add a second dimension of risk: even a previously profitable EV line could see marginal returns erode if the local-content and supplier-portfolio do not align with the new thresholds. This creates a scheduling problem for lines that must decide between advancing a pure EV output or trading toward ESS with different feedstock and logistics costs. LSI: FEOC, domestic-content, supply-chain localization
The macro picture confirms the micro effects. The IEA and BloombergNEF projections converge on a common thread: demand growth for EVs is not sufficient to absorb all capacity in 2026, especially if the rollout of ESS in grid-scale storage accelerates at a pace that competes with automotive demand. The result is a market where capacity is a sunk asset unless utilized, and where every plant’s profitability depends on the ability to adapt to policy-driven incentives while capturing new revenue from stationary storage—without overstretching construction budgets or compromising safety in dry rooms and coating lines. LSI: macro demand, ESS growth, grid storage
Block 4 — Through expert reconstruction: paths forward for operators, suppliers, and investors
What should operators and investors do in this environment? The answer is a disciplined combination of utilization optimization, strategic pivot planning, and demand-sensitive capex sequencing. First, track the utilization curve with real-time cadence: where are lines consistently above 70%? Where do you see sustained dips toward 50% or lower? The 45X credit remains the backbone of a line’s value proposition, but its benefit is contingent on the line’s actual output. Second, accelerate LFP conversion and ESS lines where demand signals indicate a durable storage market, while preserving the option value of EV lines that can return to full EV production if demand recovers. The Spring Hill retooling to LFP ESS, with approximately $70 million invested and 700 recalled workers, is a template for how to deploy capital without sacrificing long-term versatility. LSI: utilization tracking, LFP conversion, capital expenditure sequencing
Equipment suppliers should read the calendar as a forecast: coater, calender, and formation-cycler orders are the leading indicators for whether 2027–2028 commissioning is being deferred or re-chemistried. Dry-room buildouts are a long-lead item that distinguish a deferred line from a canceled one. The strongest signal of option value preservation is continued construction on second wings, as seen at De Soto, where activity signals that management intends to keep the asset in play rather than write off the full ramp. Beyond the plant-level decisions, the broader strategic question is how to coordinate with ESS offtake pipelines so that capacity is not stranded when one market segment slows and another accelerates. LSI: dry-room lead times, second-wing construction, ESS offtake discipline
For policymakers and industry observers, the story is a cautionary tale about pacing and coordination. The utilization baseline established by Kentucky, Ohio, and Kansas will define acceptable risk for the next wave of investments. The industry must balance the credit-driven incentives with domestic-content constraints and with the actual offtake pipeline for stationary storage. As the first-generation gigafactory buildout matures, the central question becomes how to optimize utilization across a dispersed network of plants, lines, and chemistries. The answer lies in a portfolio approach: run what you can profitably run, convert when it improves the overall throughput, and keep lines flexible enough to swing back to EV production if demand returns. LSI: policy coordination, portfolio approach, risk optimization
In the end, the 2026 baseline is about calculated pacing and disciplined pivoting. Kentucky going dark, Ohio pausing into mid-2026, and Kansas running at partial load are not anomalies; they are the new normal against which every remaining battery investment decision will be measured. The industry’s future rests on how quickly and cleanly it can translate nameplate ambition into reliable utilization, while maintaining the option value embedded in the 45X framework and respecting domestic-content thresholds. The calculated reallocation from EV cells to ESS cells represents a smart risk management move—provided it is paced to the actual storage offtake and backed by a robust demand pipeline. LSI: utilization-based decision-making, ESS demand pacing, investment discipline
Note: The optimization of cell utilization remains the critical lever for profitability in a market where policy incentives and demand signals converge. The 45X framework provides a structured path, but only if lines operate at scale and at pace with ESS deployment. The next 12–18 months will reveal whether the industry can convert potential into realized throughput without retracing lines or overcommitting capital to unpurchasable end-markets.
A pragmatic utilization playbook
To close the gap between nameplate ambition and realized throughput, operators need a concrete decision framework with clear thresholds, timing, and pivot rules.
| Utilization | Recommended Action | Typical Timeframe |
|---|---|---|
| 70–85% | Maintain EV output; monitor demand signals | Ongoing |
| 60–69% | Begin ESS testing; plan LFP/retargeting | 3–6 months |
| 40–59% | Accelerate dry-room expansion; start EV→ESS conversion | 6–12 months |
| Below 40% | Pause non-core lines; redeploy assets; preserve option value | 12+ months |
Case applications from Kentucky, Ohio, and Kansas illustrate how this playbook translates into action: pivot scheduling, staged ramp, and selective retention of lines for potential EV recovery, all while tracking the 45X credit against actual output.
Practical scenarios include: Scenario A — a plant operating at 62% utilization shifts to ESS as grid storage demand accelerates; Scenario B — a line at 55% ramps with LFP conversion to ESS; Scenario C — facility dipping below 40% pauses EV lines and retools for storage, preserving the asset for a later restart.
Key metrics to guide the playbook include utilization rate, actual throughput versus nameplate, and the cash-value of the 45X credit, all tracked with a quarterly cadence to steer capex sequencing and risk management. LSI: utilization, nameplate capacity, ESS deployment
What is driving utilization compression in U.S. battery plants?
Recent years have seen a pronounced mismatch between the pace of capacity announcements and the pace of end-market demand, driven by policy incentives that reward installed output rather than actual utilization and by grid-scale storage timelines that outgrow immediate EV uptake. This leaves major plants operating far below nameplate while lenders, operators, and suppliers search for pathways to preserve asset value through flexible retooling, staged ramping, and diversified product mixes across EV cells and grid storage chemistries. This creates two-sided risk: depreciation continues even as utilization falters, and the 45X incentive must be managed across EV and ESS outputs to sustain cash flows.
Analysts expect this misalignment to persist in the near term, requiring disciplined sequencing of capex and asset redeployment to maintain profitability.
How does the 45X credit influence line economics and utilization decisions?
The 45X credit pays per kWh of output (cells $35; modules $10) and is chemistry-agnostic for cells, encouraging lines to pivot without eroding the incentive. However, the credit scales with actual production, so a line running at 50% utilization earns roughly half the benefit of a fully utilized line. This structure incentivizes asset preservation and flexible scheduling, but it also means that utilization remains the decisive driver of overall returns and depreciation risk on the installed base.
Decisions therefore hinge on aligning output mix to demand signals while preserving option value for later EV recovery if market conditions improve.
What is an ESS pivot and why is it used in capex planning?
An ESS pivot redirects capacity from EV cell lines to stationary storage chemistries (often LFP) to capture grid-storage demand. This shift leverages the 45X credits while addressing the growing pipeline of utility-scale projects. In capex planning, ESS pivots enable staged redeployments, minimize sunk costs, and maintain throughput, provided the ESS demand signal proves durable and can be contracted in a timely manner.
Operators typically timetable second-wing expansions, dry-room readiness, and supplier coordination to keep lines flexible and to avoid overcommitting to a single end-market.
Which metrics should operators monitor to optimize utilization and asset value?
The core metrics are utilization rate (actual output ÷ nameplate), blended revenue per kWh, and the realized cash impact of the 45X credits. In addition, tracking the progression of dry-room buildouts, second-wing completions, and ESS offtake contracts helps forecast timing and risk. Regular scenario planning against demand projections and policy changes is essential to avoid late-stage value erosion.
What steps should investors and suppliers take to navigate 2026–2028 capital cycles?
Investors should demand clear utilization dashboards, enforce capex sequencing rules, and prioritize flexible lines with ESS conversion potential. Suppliers should align shipments to cadence indicators (dry rooms, coating lines, formation cycles) and monitor policy thresholds that affect localization and FEOC. Both groups benefit from a portfolio view that keeps EV and ESS lines coexisting, enabling swift pivots as market signals evolve.





Add a comment
To comment, you need to register and authorize
Comments