

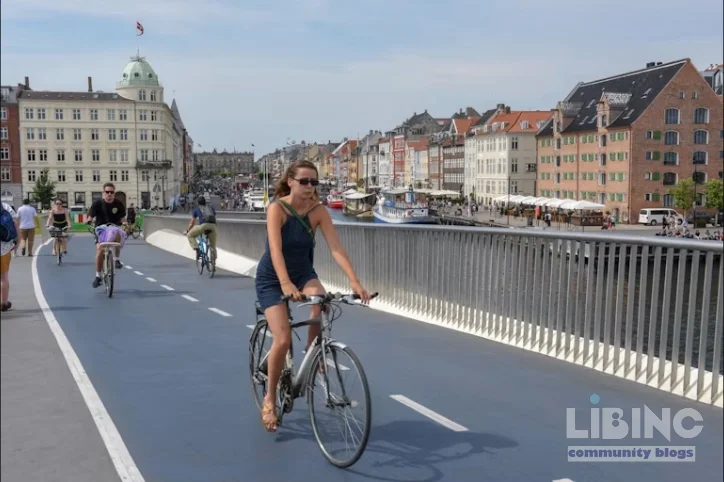
Active travel as the engine of sustainable summer tourism: designing walkable, climate‑resilient destinations
With summer travel rebounding, tourists face choices that shape destinations long after they leave. Active travel, including walking, cycling, and micro-mobility, offers a path to lower emissions, better health, and deeper engagement with local places. Yet infrastructure alone does not guarantee adoption. When cities expand cycle lanes without rider information, shade, or safe crossings, visitors may still default to car trips. Paris has announced €250 million (about £216 million) to expand cycling networks, but success hinges on usability and user comfort. Copenhagen, Utrecht, and Ghent show how maps, parking, and pedestrian‑friendly streets can transform travel psychology. This article dissects how destination design, climate resilience, and active travel intersect and outlines a framework for green holidays that stick with visitors long after departure.
- Block 1 — Analytics on active travel
- Traveler behavior and destinations
- Emissions and health impacts of active travel
- Design levers and performance metrics
- Case studies
- Economic and cultural impact
- Block 2 — Contrast: exemplars and gaps
- Exemplars: Copenhagen, Utrecht, Ghent
- Urban form and visitor experience
- Climate considerations and comfort
- Policy alignment
- Block 3 — Cause-and-effect relationships
- Heat exposure and walking/cycling
- Adaptive design impacts
- Economic and wellbeing outcomes
- Integrated climate resilience
- Block 4 — Expert reconstruction and policy guidance
- Policy blueprint
- Urban design and capacity-building
- Pilot implementations and scaling
- Monitoring and maintenance
- Closing implications
Block 1 — Analytics on active travel
Traveler behavior and destinations
Mobility data illuminate how visitors choose walking, cycling, or motorized options as they explore a destination. Active travel decisions correlate with street layout, transit reach, and route safety. When cities publish easy-to-read maps and route times, the perceived effort of a trip drops and walking and cycling become credible choices for sightseeing.
Emissions and health impacts of active travel
Switching even a fraction of tourist trips from car to pedal or foot reduces transport emissions. The health benefits accumulate as visitors weave light activity into daily itineraries. To translate this into policy, planners must couple infrastructure with wayfinding, shade, and comfortable microclimates to sustain engagement during hot days. sustainable urban mobility
Design levers and performance metrics
Key levers include:
- wider pavements
- protected crossings
- continuous cycle routes
- secure bike parking
These features reduce perceived risk and increase use. Performance metrics should cover uptake by visitors, average trip distance by foot or bike, and emissions reductions over peak periods.
Case studies
Paris, Copenhagen, Utrecht, and Ghent offer contrasting signals about how design decisions translate into visitor behavior. The Paris programme focuses on infrastructure expansion, while Copenhagen emphasizes navigation aids and comfort. Utrecht prioritizes cycling access near transit hubs, and Ghent expands pedestrian zones to connect neighborhoods with attractions. sustainable urban mobility
Economic and cultural impact
Active travel fosters longer dwell times on streets, boosting local businesses and enabling cultural exchanges between visitors and residents. When streets are safe and pleasant, walking and cycling extend visit durations and increase willingness to explore beyond the core sights. This dynamic strengthens the city’s identity while cutting emissions. sustainable urban mobility
Block 2 — Contrast: exemplars and gaps
Exemplars: Copenhagen, Utrecht, Ghent
Copenhagen is widely regarded as one of the most cycle-friendly cities, but the real driver is a system of tourist-focused maps, route times, and terrain details that reduce uncertainty for riders. It is this information layer that makes cycling an attractive choice for visitors who want to see more, in less time, with lower emissions. The result is a city that feels navigable even to first-time riders. sustainable urban mobility
Urban form and visitor experience
Utrecht anchors cyclists with priority on major corridors and the central station’s indoor bike parking. These features translate into a reliable, predictable travel experience for visitors. Ghent pedestrianizes many streets and connects attractions with more than 300 km of protected bike lanes, turning travel into an exploratory activity rather than a barrier. sustainable urban mobility
Climate considerations and comfort
In hotter climates, active travel becomes vulnerable to heat stress unless shade and rest opportunities exist along routes. The design response includes shaded walkways, trees, water stops, and accessible public toilets integrated into the mobility network. When climate adaptation is baked into the route experience, visitors perceive active travel as a reliable option rather than a seasonal luxury. sustainable urban mobility
Policy alignment
Policy must align land-use planning, transit schedules, and tourism strategies to sustain momentum. Cities that coordinate maintenance, safety audits, and real-time information perform better in converting interest into action. The lesson is clear: without coherent policy support, even well-built networks fail to shift the travel profile of visitors. sustainable urban mobility
Block 3 — Cause-and-effect relationships
Heat exposure and walking/cycling
Extreme heat reduces walking and cycling engagement, particularly among older travellers and families. Temperatures above comfortable thresholds limit the practical length of trips, and long walks in heat burn energy visitors would rather conserve for experiences and dining. The result is a retreat to car-based options that undermine emissions targets and local economies.
Adaptive design impacts
Climate adaptation strategies change the calculus for travellers. Shade along routes, drinking water, and cool spaces extend the feasible window for active travel. When these features are visible and accessible, people are more likely to choose walking or cycling for longer legs of their itineraries. sustainable urban mobility
Economic and wellbeing outcomes
Walking and cycling increase dwell time on main streets, boosting retail and cultural experiences that define a destination. The wellbeing benefits accrue to residents who become ambassadors, helping to dilute the perception that tourism creates a pressure cooker environment during peak seasons. The combined effect is a more resilient, inclusive tourism economy.
Integrated climate resilience
Integrated design weaves heat mitigation into street networks, parks, and shade trees. Wider pavements and green corridors become climate amenities and public health assets. When the environment is pleasant, walking and cycling become a social habit rather than a rare activity. sustainable urban mobility
Block 4 — Expert reconstruction and policy guidance
Policy blueprint
The blueprint starts with a citywide commitment to active travel as a core mobility priority. It links transit planning with walking and cycling targets and ties funding to climate-resilient features in tourist corridors. Metrics should measure mode share shifts, emissions reductions, and user satisfaction across seasons.
Urban design and capacity-building
Urban design must institutionalize practical features: protected intersections, generous sidewalks, abundant bike parking near attractions, and multilingual wayfinding. Cities can pilot micro-districts where extended sidewalks and car-free blocks become normative, then scale those successes. sustainable urban mobility
Pilot implementations and scaling
Governments should test programs with transparent evaluation criteria, balancing infrastructure build-out with ongoing maintenance. Real-time data on route usage, safety incidents, and heat-related comfort scores guide adjustments. When pilots show promise, scale them with community co-design to ensure broad appeal.
Monitoring and maintenance
Maintenance routines, seasonal safety audits, and responsive customer support ensure long-term quality. Training for staff, clear accountability lines, and public reporting create trust among visitors and residents. The objective is a durable, adaptable network that climate and crowds do not erode over time. sustainable urban mobility
Closing implications
Active travel is not a niche option but a design imperative that shapes how tourists experience a destination and how cities manage heat, congestion, and energy use. By fusing analytics, inclusive design, climate adaptation, and policy governance, destinations can offer a compelling, low-emission summer experience that satisfies residents and visitors alike. The path to scalable, resilient tourism runs through streets designed for walking and cycling, not just the roads built for cars.
Bridging to action: practical steps for destination design
Even with strong evidence on the benefits of active travel, cities must translate insights into a clear, budgeted action plan that tourism, mobility, and urban planning teams can execute across seasons. The following capsule offers concrete steps, linked to governance roles, timelines, and measurable targets that destinations can adapt for summer visitor flows while preserving resident quality of life. It emphasizes visibility, comfort, and feedback loops to ensure that walking and cycling remain attractive beyond peak days and into shoulder seasons.
Description: A compact data capsule pairing implementation levers with practical metrics to help cities turn design ideas into lasting visitor experiences.
| City feature | Maps & route clarity | Shade & microclimate | Crossing safety | Nearby amenities |
|---|---|---|---|---|
| Copenhagen | Tourist maps with times | Extensive tree cover | Protected crossings | Strategic bike parks near sights |
| Utrecht | Clear wayfinding at stations | Shaded corridors | Safe intersections | Transit-adjacent cycling hubs |
| Ghent | Pedestrian zones to connect attractions | Water features along routes | Low-speed streets | Shopfront seating & rest stops |
Analysis: The combination of navigable maps, shade, safe crossings, and convenient bike parking lowers the perceived effort of active trips, supporting sustained visitor uptake and aligning with climate-resilient design goals.
Key insight: Shade and resting opportunities can extend the practical window for walking and cycling by up to 40% on hot days.
Practical implication: Plan route networks with shade trees every 300–500 meters, misting stations at major nodes, and accessible public toilets integrated into mobility corridors.
Description: Heat mitigation features integrated into tourist corridors create predictable travel experiences that feel comfortable, even in peak afternoon hours.
Implementation flow
- Assess routes for shade, water access, and maintenance needs.
- Pilot protected corridors near attractions with real-time information.
- Scale with community co-design and seasonal adjustments.
In practice, a destination could start with a two-month pilot in a high-traffic pedestrian corridor, install shade canopies and water taps, publish bilingual route maps, and collect feedback through QR surveys at key waypoints.
What design elements most effectively encourage visitors to choose active travel?
Real-world evidence shows that the most effective elements blend safety, comfort, and convenience in a single experience; real-time route information reduces uncertainty for first-time riders, protected intersections shield travelers from traffic, shaded rest zones counter heat burdens, and well-placed bike parking near attractions minimizes detours, all supported by multilingual signage and seamless door-to-transit connections that make active travel competitive with car trips in both time and perceived effort. Additionally, inclusive design that accounts for families, older travelers, and mobility devices expands the audience and sustains use across seasons; governance coordinating maintenance, transit, and tourism messaging ensures consistency; pilots with rapid feedback loops guide adjustments.
How should a city measure the impact of active travel initiatives on visitors and the economy?
The most informative measures combine process and outcome indicators: uptake by visitors (share of trips made on foot or by bike), average trip length, and mode share shifts by season; emissions reductions and energy use; dwell time on main streets; and visitor satisfaction scores tied to experiences along active corridors. Integrating data from wayfinding apps, sensor counts, and merchant receipts helps verify economic benefits for local businesses and cultural venues. Regular heat comfort scores and safety audits also reveal resilience performance across climate conditions.
What governance practices support durable adoption of active travel for tourists?
Durable adoption arises from cross-sector collaboration that aligns transport planning, tourism programming, and urban design with clear accountability. A shared governance charter sets targets, assigns responsible agencies, and mandates seasonal maintenance cycles, safety audits, and transparent reporting. Public engagement during pilots builds trust and yields co-designed solutions that reflect local culture and visitor expectations. Long-term success depends on flexible funding that can scale successful pilots and sustain upgrades between peak seasons.
Which climate-resilient features deliver the best visitor experience without compromising residents?
Key features include shade-rich street canopies, water stations, cool zones, and permeable pavements that reduce heat islands while maintaining accessibility. Rest facilities at regular intervals and intuitive wayfinding reduce fatigue and confusion for visitors. Importantly, climate resilience should be woven into maintenance schedules and safety checks so that the network remains inviting under varying weather conditions, seasonality, and crowding levels.
How can cities pilot and scale active travel without overextending budgets?
Start with low-cost, high-impact pilots in concentrated districts that connect major attractions and transit hubs. Use existing funding streams for maintenance, while testing smart, modular improvements like shade canopies and temporary protected crossings. Implement a simple evaluation framework with quarterly updates, public dashboards, and stakeholder feedback to guide scaling. Co-design with local businesses and residents to ensure buy-in and shared responsibility for upkeep.
What role do maps and wayfinding play in changing visitor travel psychology?
Maps and wayfinding lower cognitive load, making routes feel reliable and time-accurate; when visitors can predict trip duration and effort, walking and cycling feel like viable sightseeing modes rather than add-ons. High-quality, multilingual maps at transit hubs, museums, and popular routes create a sense of confidence that sustains active travel across seasons and crowds.





Add a comment
To comment, you need to register and authorize
Comments
To advance from concept to durable change, cities might test a holistic package: clear, multilingual maps that reveal not just distances but the effort required, shaded promenades that invite daylong strolling, and safe, well lit crossings that couple with transit hubs so that a visitor can transition between walking, cycling, and bus or rail without hesitation. The experiential layer matters as much as the physical one. When a city builds a great protected lane but neglects shade or hydration options, the pedal becomes a chore rather than a pleasure, and interest wane. Conversely, a route that channels visitors through well connected neighborhoods, markets, and cultural sites can turn active travel into a narrative—an opportunity to linger, to notice hidden corners, to meet residents, and to support locally owned shops.
A fertile area for discussion is the role of policy alignment and maintenance. Who pays for ongoing street safety audits, seasonal cleaning, and timely repairs after weather events? How can cities coordinate transit timetables, street improvements, and tourism marketing so that a plan for walkers and cyclists remains coherent through peak seasons and off peak months? We might also consider equity: does prioritizing pedal traffic risk displacing residents or pricing out accommodations that rely on car access? How can we ensure that low income neighborhoods benefit from the same access to shaded routes and secure bike parking as central districts? Finally, what does success look like beyond emissions reductions—do longer dwell times translate into meaningful cultural exchange and local economic resilience, and how can we measure that in a way that resonates with both visitors and residents?
This prompts a broader reflection on learning from exemplar cities: what elements of their maps, shade strategies, or pedestrianized zones translate most reliably to other contexts? Are there universal design principles that transcend climate zones, or must every destination tailor every lever to local heat profiles, street widths, and cultural rhythms? The central question is how to embed active travel into the tourist journey as a sustainable habit—one that visitors carry home in memory and, ideally, in future travel choices.