

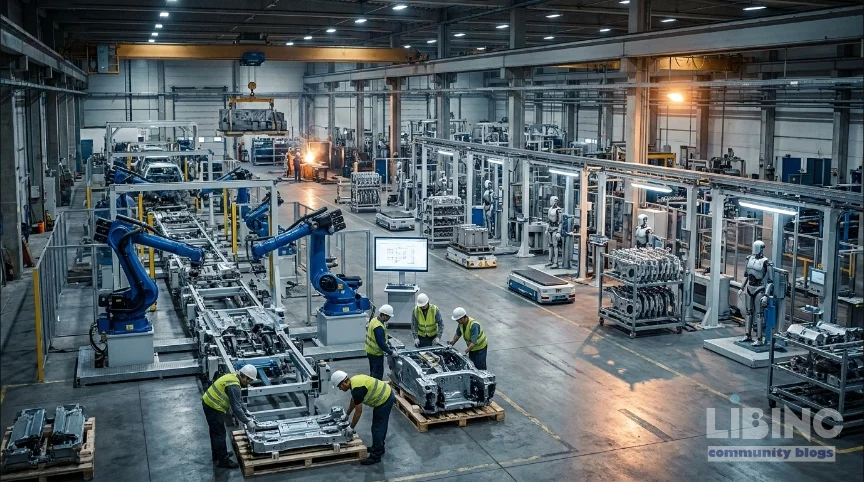
Optimus and the capital-efficient bet: Tesla's Fremont conversion as a manufacturing economics test
Tesla's decision to retire the S/X assembly line and repurpose Fremont floor space for Optimus creates a stark, decision-driven experiment in capital allocation. If a car-plant play can produce a 10,000-part humanoid at automotive scale, what does that imply for unit economics, reliability, and payoff timing? The 46‑day teardown signals speed, but speed without a credible cost curve risks misallocating capital. Tesla targets roughly $20,000 cost of goods per unit and a consumer price under $25,000, a combination that only makes sense if volume, vertical integration, and part-count reduction bend the cost curve. The critical question for operators is whether that manufacturing bet can translate into real productivity gains, or if the line remains a learning exercise with limited near-term impact on throughput. Optimus is both a product and a proof point for manufacturing discipline.
Through analytics: modeling Optimus economics on a car-line rhythm
In planning, Tesla treats Optimus as a high-volume product. The Fremont conversion aims for up to one million units per year, anchored by a line designed like Model 3/Y production. This isn't an R&D prototype; it's a production system with a measurable cost-of-goods target. The key levers are volume, part-count reduction, and learning curves. The BOM for a 10,000-piece robot implies each increment in throughput yields a larger drop in fixed costs per unit, even if initial yields stay modest. Each robot deployed on the line becomes data and a test case for labor displacement versus automation investment. The framework here is relentlessly metric-driven: throughput per shift, yield by station, and the rate at which automation displaces human labor without compromising quality.
- Capacity design and scale expectations
- Cost structure per unit and its interface with price
- Learning curves and yield ramp
- In-plant deployment as a data source for iteration
As a consequence of these levers, Optimus becomes a test of whether a capital-intensive process can tighten the gap between labor hours and task-costs, while maintaining quality. The production system will produce not only units but evidence of cost-per-task that operators can use to decide whether to deploy similar lines for other tasks. The emphasis remains on the math of unit economics rather than demonstrations of novelty. The sheer scale implies that even modest improvements per unit accumulate into decisive value over a few quarters.
Through contrast: robotics vendors vs carlike manufacturing of a humanoid
Most robotics players tooling up for humanoid tasks treat the robot as a laboratory object, with bespoke fixtures and slow, incremental improvements. Tesla contrasts with a more traditional route by designing Optimus as a high-volume product that can ride the same disciplined manufacturing logic that underpins the Model 3 and Model Y. The difference shows in the playbook: maintain in-house tooling, standardize parts, reduce variation, and push through a single line with a clear cost structure. The result is a tighter feedback loop: the same line that builds the robot also trains it by collecting data and testing reliability on the factory floor. That loop, if proven, can compress the learning period from years to quarters and turn data into a competitive advantage for mass production.
- Vendor-driven customization vs automotive-grade standardization
- External ROI signals vs internal ROI signals
- Prototype robots vs production robots with serviceability targets
- Single-line discipline vs multi-vendor integration challenges
In practice, the contrast matters because it changes risk profiles. A humanoid built at scale must prove uptime and reliability as aggressively as it proves capability. Throughput and cost-per-task become the heartbeat metrics, not just novelty. If Optimus can deliver consistent performance on the line and in the field, the vendor-versus-plant debate tilts decisively toward the carmaker's playbook.
Through cause-and-effect: Fremont teardown and unit economics
The teardown of the legacy S/X line is not a side note; it is a deliberate capital decision that redefines capacity. By freeing up underutilized automotive floor space, Tesla converts a fixed asset with limited yield into a launchpad for Optimus. The immediate effect is a second production stream at Fremont, alongside Model 3 and Model Y, that remains a testbed for scalable automation rather than a wholesale pivot away from cars. The Gen 3 milestone signals a cognitive shift: the line will be redesigned to drive cost down with each generation, not merely to showcase hardware capability. The longer-term effect depends on reducing the bill of materials and increasing the number of units per line per year. If the Gen 3 improvements succeed, the math becomes more favorable and the ramp risk recedes.
- Teardown enables architectural reuse of assets
- Automotive discipline applied to robotics reduces process variation
- In-plant deployment generates data to drive cost-per-task improvements
- Ramping issues tied to thousands of parts become the main risk to profitability
The economics hinge on four interrelated forces: part-count reduction, vertical integration, manufacturing learning curves, and robust quality control. Each force pushes the unit cost down or the output up, but only if the line achieves steady-state yield on a continuous basis. Until then, the quote of a million units per year remains a target, with early output described as modest and deliberately gradual. The real test is whether early data can translate into faster cost familiarities and reliable throughput across shifts.
Through expert reconstruction: what operators should do next
Operators facing this blueprint should treat Optimus as a manufacturing hypothesis rather than a final product. Start with a rigorous ROI model that separates capital amortization from labor savings and demand-side uncertainties. Build a phased roadmap: pilot cells in parallel with fixed automation that already provides reliable throughput, then incrementally replace or augment those cells with Optimus workstations as data proves the task can be done cheaper and faster. Track a focused set of metrics that reveal true leverage: uptime and MTBF, yield at each critical station, the rate of part-count reduction, mean-time-to-detect and fix defects, and the cost-per-task for actual tasks completed. The Gen 3 reveal will be a litmus test; until then, make Optimus deployment a living, data-driven program that informs supplier choices and internal process design.
- ROI modeling and cost-per-task evaluation
- Pilot-within-a-pilot approach to experimentation
- Key metrics: uptime, MTBF, yield, BOM count reductions
- Integrated supplier and in-house development strategy
In sum, the Fremont case is a disciplined bet on manufacturing discipline rather than a science experiment in artificial intelligence alone. If Optimus can execute on cost and reliability at scale, the value proposition expands beyond a single product to a repeatable automation play for the factory floor. The data will determine whether the robot becomes a true cost lever or remains an expensive curiosity that displaces labor without delivering durable throughput gains.
Bottom line: the Optimus bet is a manufacturing hypothesis tested at automotive scale. The path to profitability hinges on translating a $20,000 per-unit target into real labor substitution and fixed-asset efficiency, while keeping uptime and quality intact across generations and shifts. Fremont is a pilot, not the endgame; the Gen 3 moment will reveal whether the thesis pays off for operators who adopt this approach.
Operational blueprint and risk controls
To render Optimus as a repeatable productivity lever, operators should ground the concept in a phased, data‑driven ROI plan that decouples capital amortization, labor substitution, and demand risk. A practical scenario starts with pilot cells that achieve roughly 85% uptime and 10–15% yield at early stations. As volume grows, cost‑per‑task falls with learning curves and part‑count reduction, while BOM counts drop 20–40% in the first year. A two‑stage ramp helps manage risk: stage one compares the automation line against a fixed baseline; stage two scales to the target rate of up to one million units per year. A robust framework ties uptime, MTBF, waste, and defect rates to supplier reliability and tooling design, turning data from every shift into a tighter cost curve and faster throughput."
Yes—the target cost of goods per unit is about $20,000 and the intended consumer price is under $25,000, and achieving this requires a high‑volume, capital‑light approach that blends vertical integration, standardized parts, and a lean bill of materials so that every incremental unit lowers fixed costs and compounds throughput across generations. In practical terms, operators should build a phased ROI model that separates capex, labor displacement, and demand risk, using scenario analyses to monitor burn rate, payback, and sensitivity to yields, supplier reliability, and maintenance costs. The path hinges on maintaining steady demand signals and reliable supply chains as volumes rise. From here, monitor the delta in cost per task as each new generation comes online, and adjust contracts and tooling to lock in savings as volume expands. Yes—the teardown frees automotive floor space for a new production line and enables asset reuse, which can shorten capital cycles and tighten the feedback loop between design and manufacturing. The outcome depends on achieving a stable yield ramp, reducing BOM complexity, and maintaining uptime across shifts. The risk is that early output remains modest; the payoff emerges when Gen 3 improvements translate into meaningful per‑task savings and reliable throughput. Yes—the core distinction is treating Optimus as a high‑volume production product rather than a lab demo. Automotive discipline, standardization, in‑house tooling, and a single‑line data loop drive faster reliability gains and cost reductions, turning the robot into a scalable cost lever rather than a one‑off prototype. The result is a tighter integration between hardware, software, and process design that shortens the learning horizon and improves uptime predictability. The most informative metrics include uptime (MTBF), yield by station, BOM reductions, cost per task, defect rate, and the rate of labor substitution versus automation investment. Tracking these across shifts and generations reveals where the line truly adds value and where supplier or tool changes are warranted. A dashboard linking throughput, quality, and capex amortization makes the ROI narrative concrete for leadership and operators alike. Yes—the plan is a phased rollout: baseline lines to establish stability, pilot Optimus cells to prove cost per task improvements, and then scaled automation to reach the target volume. Each phase should include predefined success criteria, supplier readiness, and a change‑management protocol to preserve quality and safety during expansion. Yes—top risks include unreliable parts, maintenance bottlenecks, and unintended process variation. Mitigations involve modular tooling, rigorous MTBF targets, preventive maintenance, and a fast feedback loop from on‑line data to design revisions. A contingency plan for supply disruptions and a staged price‑volume contract strategy help lock in favorable economics as output climbs toward 1M units/year.What is the unit‑cost target and price point for Optimus?
How does the Fremont teardown influence economics and risk?
What differentiates Optimus from conventional robotics programs?
Which metrics matter most for operators?
What is the recommended rollout plan?
What are the top risks at scale and mitigations?





Add a comment
To comment, you need to register and authorize
Comments